Even though MLB is in the midst of the 2026 season, scouts are still minding future prospects to draft in the near future.
Teams draft based on value, meaning the elite players tend to leave in the first round; however, how much of a correlation does draft position have with future MLB pay?
To assess this, the 2019 draft was selected to identify a player pool. Since all of the players drafted in 2019 would not be playing on any sort of first-year pay, this year was chosen. The first and second round draft selections (1-78) were identified using Baseball Almanac records. The current pay of the 2020 draftees was determined with Spotrac, using the 2026 Cash metric.
The independent variable in this study was the draft position of a given player, and the dependent variable was the amount of money the player is set to be paid in the 2026 season. For players that are free agents, or are retired, their 2026 Cash was listed as 0 for the purposes of this study.
The first and second rounds of the 2019 draft were analyzed holistically:
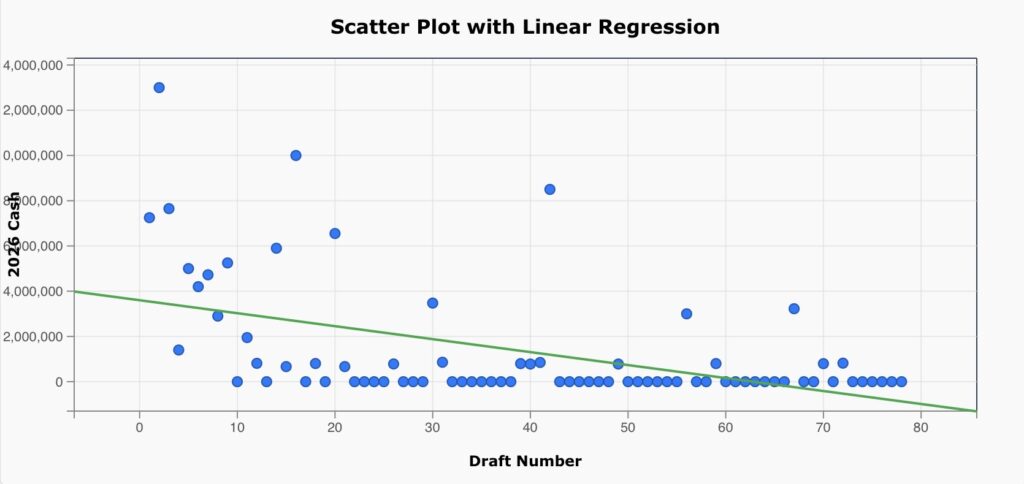
A correlation of r=-0.49 was found, indicating a negative, moderate relationship. The negative correlation indicates that as draft number increases, 2026 Cash decreases. Since the relationship is moderate, it creates the idea that while having a higher draft number points toward success, there is still variance in future pay. An r2 value of 24% was found, meaning that 76% of the factors that go into salary do not include draft number.
The first round of the 2019 draft was analyzed individually:
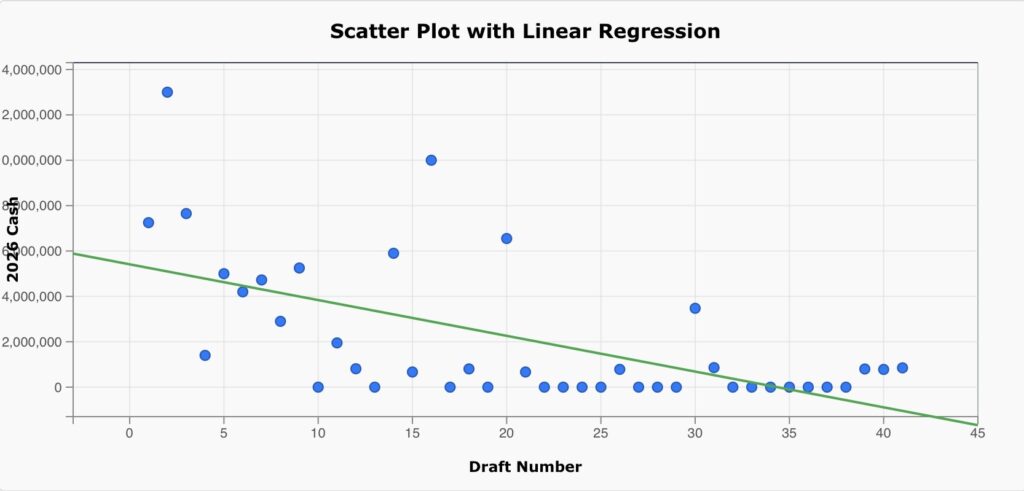
A correlation of r=-0.60 was found, indicating a negative, moderate relationship. The negative correlation indicates that as draft number increases, 2026 Cash decreases. Since the relationship is moderate, it creates the idea that while having a higher draft number points toward success, there is still variance in future pay. An r2 value of 36% was found, meaning that 64% of the factors that go into salary do not include draft number.
The second round of the 2019 draft was analyzed individually:
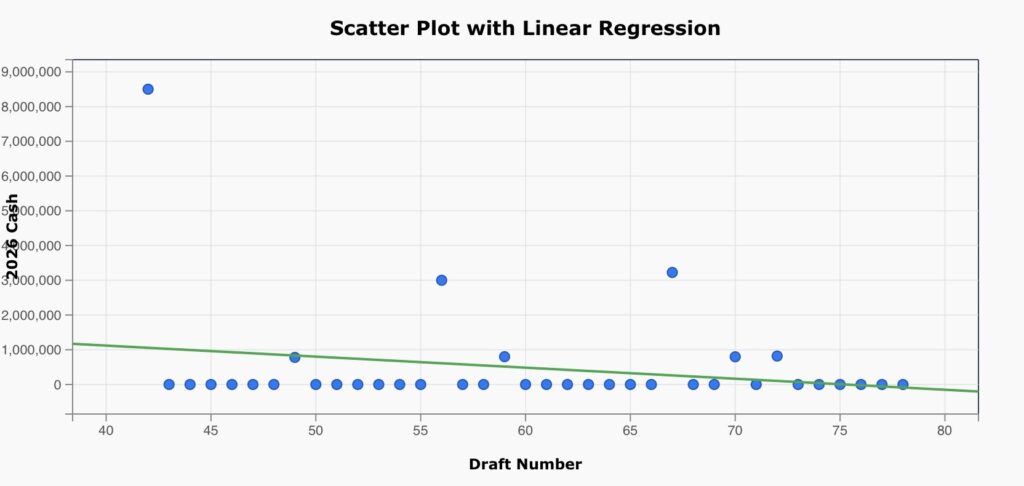
A correlation of r=-0.22 was found, indicating a negative, weak relationship. The negative correlation suggests that as draft number increases, 2026 Cash decreases. Since the relationship is weak, the negative trend has little meaning. An r2 value of 5% was found, meaning that 95% of the factors that go into salary do not include draft number.
| 1 | 7250000 |
| 2 | 13000000 |
| 3 | 7650000 |
| 4 | 1400000 |
| 5 | 5000000 |
| 6 | 4200000 |
| 7 | 4725000 |
| 8 | 2900000 |
| 9 | 5250000 |
| 10 | 0 |
| 11 | 1950000 |
| 12 | 811500 |
| 13 | 0 |
| 14 | 5900000 |
| 15 | 667360 |
| 16 | 10000000 |
| 17 | 0 |
| 18 | 803200 |
| 19 | 0 |
| 20 | 6550000 |
| 21 | 667360 |
| 22 | 0 |
| 23 | 0 |
| 24 | 0 |
| 25 | 0 |
| 26 | 783700 |
| 27 | 0 |
| 28 | 0 |
| 29 | 0 |
| 30 | 3475000 |
| 31 | 860000 |
| 32 | 0 |
| 33 | 0 |
| 34 | 0 |
| 35 | 0 |
| 36 | 0 |
| 37 | 0 |
| 38 | 0 |
| 39 | 799350 |
| 40 | 780000 |
| 41 | 850000 |
| 42 | 8500000 |
| 43 | 0 |
| 44 | 0 |
| 45 | 0 |
| 46 | 0 |
| 47 | 0 |
| 48 | 0 |
| 49 | 780000 |
| 50 | 0 |
| 51 | 0 |
| 52 | 0 |
| 53 | 0 |
| 54 | 0 |
| 55 | 0 |
| 56 | 3000000 |
| 57 | 0 |
| 58 | 0 |
| 59 | 800000 |
| 60 | 0 |
| 61 | 0 |
| 62 | 0 |
| 63 | 0 |
| 64 | 0 |
| 65 | 0 |
| 66 | 0 |
| 67 | 3225000 |
| 68 | 0 |
| 69 | 0 |
| 70 | 797500 |
| 71 | 0 |
| 72 | 818900 |
| 73 | 0 |
| 74 | 0 |
| 75 | 0 |
| 76 | 0 |
| 77 | 0 |
| 78 | 0 |