
By: Eleanor Parsinen
Received a 5 on the AP Research Grading Scale
Abstract: This study utilizes a quantitative, nonexperimental correlational design to investigate the relationship between roster polarization, defined as the combined salary cap percentage of a team’s top three highest-paid players, and both competitive performance (season win percentage) and fiscal outcomes (team revenue) from 2020 through 2024. A random sample of eight franchises, representing one team from each NFL division, was analyzed using data from Over the Cap, performance metrics from Pro Football Reference, and financial records from Statista. Pearson’s correlation coefficient (r) calculations revealed a moderate positive relationship (r=0.53, explaining 28% of variance) between cap concentration and season record. The analysis identified a near-zero correlation (r=0.0003) between cap concentration and localized team revenue, a result that remained weak even when controlling for the 2020 global pandemic (r=-0.074).
Keywords: National Football League, quantitative, correlation, non-experimental, team record, cap concentration, team revenue, franchise
A Sunday ritual for most households, the National Football League (NFL) provides entertainment that allows for a break from normal life. To provide the thrill of an unexpected Hail Mary, or the excitement of a Superbowl win, NFL organizations pour endless time, money, and thought into crafting a successful franchise. Unlike Major League Baseball (MLB) or the National Basketball Association (NBA) that have loose salary cap structuring, the NFL operates under a fixed cap ceiling. For example, in 2026, the NFL salary cap was set at $301.2 million, forcing each team’s roster expenditures to fall below that number, and in order to do so, each team has to decide how they want to design their roster. Some teams decide to spend less in order to succeed in later seasons, and other teams decide to spend a great amount of their money on a focused group of players. For clear understanding of this study, it is important to know these terms:
- Point Differential: The numerical difference between a team’s total points scored and total points allowed over a specific time period (Pro Football Reference)
- Expected Points Added (EPA): Metric that measures the value of a play by calculating the difference in expected points between the start and the end of the play (Pro Football Reference)
- Quarterback Rating (QBR): Numerical formula measuring quarterback passing efficiency on a scale of 0 to 158.3, based on completion percentage, yards per attempt, touchdown percentage, and interception percentage (Pro Football Reference)
The purpose of this study is to determine the relationship between highly-paid players and holistic turnouts among NFL organizations. To measure the outcomes of teams, performance and fiscal outcomes will be incorporated into this study. This begs the question: How has overpaying elite male athletes in the National Football League impacted overall team outcomes from 2020-2024?
Positional Value
To determine whether a player is overpaid or not, their contribution with the team is compared to similar players through various common and advanced metrics. Ronan Walsh, who holds a bachelor’s degree in Information Technology from the University of Dublin, analyzes the impact of performance metrics in the NFL in “Identifying significant features for Player Evaluation in NFL comparing ANNs and Traditional Models.” Walsh found that the overall team performance can be measured using metrics such as their total record, point differential, and EPA. In professional sports leagues like the NFL, scouts and coaches look for talent that meets their criteria. To make sure that they do not overlook a bad lead, it is essential they look at performance metrics that identify a greater chance of success in the league. Some of the constituent components to the scout or the front office’s opinion on a player include their athletic capabilities such as speed, strength and ability, and their intellectual ability (Walsh). What matters most, however, is whether the position is of value or not. When analysts are assessing if granting a large contract to a player is favorable or not, they will look at the position of the player.
In “Where Should NFL Teams Invest Their Financial Resources?” Peter Renkoski, who graduated from the Samford University with a Bachelor’s degree in Economics with a focus on Sports Analytics, states that the “…offensive line is the most important position to the most successful teams, based on salaries.” Considering the fact that the offensive linemen protect the passer from pressure, having talented players at the position is essential so that the quarterback is more comfortable in the pocket. However, since there are five men on the line, the amount of money allocated to the offensive lineman is a balance of talent and volume (Renkoski).
Furthermore, Jason Mulholland, a lecturer at Columbia University and Chief Analytics Officer for Big League Advantage, adds in “Optimizing the allocation of funds of an NFL team under the salary cap” that it is important to invest on both sides of the ball. Paying elite talent at the quarterback, linebacker, guard, and defensive line positions is worth the cap hit; however, it is essential to maximize spending through the NFL draft. Quarterback is arguably the most important position in sports, so it is important to invest in a team leader who is talented and composed. Most importantly, finding talent through the draft will allow teams to fill their locker rooms with play makers for a fraction of the price of a veteran (Mulholland).
Effective roster construction requires a change from traditional scouting toward a data focused evaluation. Walsh suggests that advanced metrics are essential for identifying a translation to NFL performance, which is necessary to avoiding a negative cap turnout. This data driven approach justifies the financial investment in the offensive line that Renkoski and Mulholland identify as a standout part of successful organizations. However, the high cost of the offensive lines creates a fiscal deficit. As Mulholland states, teams must offset these contracts by finding cheap talent in the draft.
Impact of Roster Polarization
Some NFL teams tend to concentrate a great amount of their salary cap on one player. David Berri, a professor of Economics at Southern Utah University, states in “Salary Determination in the Presence of Fixed Revenues” that salary can fluctuate based on the talent, or public image of a player. Berri suggests teams will sometimes pay players more if they are popular among the fanbase (Berri). After all, if a well liked player remains on the team, then it would make sense for the fans to have greater engagement. In the NFL, quarterbacks tend to be paid more than other positions (Berri). For these reasons and as seen in Mulholland’s findings, making the correct decision at quarterback is both difficult and important, but does spending too much on one player have an unjustifiable, negative impact on the team?
Joseph Higgins, who received his bachelor’s degree in Mathematics from State University of New York, writes about the impact of Matt Ryan’s contract on the Atlanta Falcons’ performance from 2018-2020. In his research titled “Evaluating the Value of an NFL Quarterback”, he highlights Ryan’s 5-year, $150 million dollar contract extension, which equaled to about $27 million per year without bonuses. While Ryan was at once the reason for Atlanta’s success, he led the team to consecutive 7-9 seasons, followed by a 4-12 season (Higgins). In 2018, Ryan was the highest paid quarterback in the NFL; however, the Falcons had losing records in his last five seasons with the team. Additional effects on the play of the team could include great deficits in other positions, injury, or a team rebuild; however, Ryan’s play was in decline for multiple years where any of these external factors could have been easily assuaged (Higgins). While the Falcons were paying Ryan a great amount of money, they were not receiving the on-field impact that was expected.
Furthermore, Christopher O’Connor, a Professor of Medicine at Duke University, describes the winning attributes of the infamous quarterback in his article titled “Heart Failure Leadership, Culture, and Governance: Lessons Learned from Tom Brady.” O’Connor first emphasizes the fact that the Tampa Bay Buccaneers had only one season with a record above .500 before Brady led the team to a Super Bowl win. While Brady focused on recruiting players to join him in Tampa Bay, he also set a specific ceiling for his personal cap hit so that more money could be allocated to other positions (O’Connor). Brady’s team friendly mindset allowed for the teams he led to the great successes they had. The seven-time superbowl champion had the talent to receive a much greater paycheck, however, he knew that reserving money for other positions would benefit him in the long run (O’Connor).
In “Income Taxes and Firm Competitiveness: A Case Study from the National Football League”, Benjamin Posmanick, assistant professor of finance at St. Bonaventure University, states that in Brady’s time with the New England Patriots, he would sign contracts that were out of balance with his performance level. Even though he was getting paid less, Brady was able to lead the Patriots to six Super Bowl wins through his talent and talent surrounding him. Because Brady let the front office spend in other places, they were able to flourish to the magnitude they achieved (Posmanick). Brady helps establish the fact that while investing in a player at an elite position, such as quarterback, teams should try to negotiate and structure contracts in a team friendly sense.
In Brendan Woods’s “Quarterback Statistics vs. Season Success”, the Louisiana Tech graduate with a bachelor’s degree in mathematics explores the correlation of QBR and team success. Woods assessed quarterback rating for the 2006, 2011, 2017, and 2023 and searched for the most clear relationship between the performance of the quarterback and the performance of the team. In his 2011 findings, Woods writes,“This trend was reflected in players like Aaron Rodgers, whose high QBR of 83.8 led the Packers to a top spot in the power rankings, while quarterbacks like Kyle Orton and Tim Tebow, with a lower QBR of 45.8, were linked with lower team rankings” (Woods). Aiding in the previous research of O’Connor and Higgins, the talent of the quarterback is a great determinant of team play. Kyle Orton, who led the team to a 1-4 start in the 2011 season, was benched and his replacement brought back the team’s record to .500 (Woods). While there could have been external factors such as injury impacting the Denver Broncos’ performance, the fact that their record increased after Orton was benched suggests that he was the main reason for their record.
While Woods’s findings suggest that quarterback performance is the greatest determinant of a team’s success, the fiscal allocation of the position creates significant balancing issues for front offices. Berri notes that teams often overpay popular players to keep fans engaged, yet Higgins demonstrates the downfall of this approach through the case of Matt Ryan. Ryan’s contract extension created a deficit where his poor on-field impact no longer justified his cap hit, preventing the Falcons from allocating their funds to other positions.
Matt Ryan’s contract is contrasted by Tom Brady’s team friendly signings. O’Connor and Posmanick argue that while Brady was a talent, his respective teams’ success was also determined by his sacrifice of personal financial gain. By setting a cap ceiling for himself, Brady mitigates the issues that Berri and Higgins warn against. All in all, Woods’s correlation between QBR and team success displays a need for talent at quarterback, yet the talent must be balanced with the quarterback’s market value.
Market Value
All sports leagues are businesses that have one goal: to increase revenue and engagement. According to the NFL Players Association, big streams of revenue come from sponsorships, national and local media deals, ticket sales, concession sales, and merchandise sales (NFLPA). Each profit point is driven by consumer engagement, forcing the NFL to keep fans immersed in the game.
In “Determinants of Revenue in Sports Leagues: An Empirical Assessment”, John Charles Bradbury, professor of economics at Kennesaw State University, explores the factors that go into the fiscal outcomes of a sports team. Bradbury states that on-field success does not determine revenue in the NFL. Unlike other major sports leagues like the NHL, MLB, or NBA, Bradbury explains that NFL revenue remains constant due to a minimized amount of games played per year. One thing that all of the sports leagues have in common, however, is the fact that teams who play in older stadiums make less money in ticket sales than teams who play in newer stadiums (Bradbury). Hence, NFL teams that play in newer stadiums have a greater potential to make more money than teams that play in older stadiums.
Further, in “Revenue sharing as an incentive in an agency problem: an example from the National Football League”, professor of economics at the University of Georgia, Scott Atkinson, describes the implications of revenue sharing. Atkinson describes an “agency problem” in the NFL, where the team owners elect a league commissioner, while also building their own teams. Owners try their best to build a successful team to build profit, while it ends up being shared by the entire league. The NFL established a rule that shares league revenue among teams, and Atkinson found that “profit-maximizing owners” do not care about potentially lower wages through revenue sharing, but maximizing profit through winning (Atkinson).
Financial success in the NFL is determined by a multitude of possibilities. Bradbury argues that the NFL’s season length controls potential game-day earnings, and that having a modernized venue benefits ticket premiums. However, this focus on the physical aspect of the game is complicated by an “agency problem”. While Bradbury suggests winning has a negligible impact on revenue due to the league’s structure, Atkinson argues that owners are driven by a “profit-maximizing” desire to win. Even though the NFL’s revenue-sharing creates a more standard earning basis for each team, Atkinson’s findings suggest that owners do not settle; instead, they view winning as the primary driver for revenue. Therefore, while new stadiums provide the physical capacity for higher revenue (Bradbury), the league’s unique economic sharing structure ensures that owners still prioritize competitive success (Atkinson).
Gaps
While the previous research states that it is important to find a balance between talent and price in NFL athletes, there has been no research on how paying athletes high amounts of money has impacted team outcomes (except for the quarterback position). Additionally, even though it has been found that season record does not impact team revenue, there has been no determination whether or not having a high cap concentration has an impact on season record. Overall, the research that has formerly been conducted has been consolidated to confined models of analysis, failing to account for the impact of overpaying athletes on a holistic scale.
Methodology
This study will explore the relationship between highly paid NFL players and the performance of their team. The goal is to find a potential correlation between a salary cap concentration on a group of players and the end results of the respective teams. This is important because teams around the NFL are consistently inefficient with their salary cap management, leading to an organizational gridlock. To answer the question at hand, quantitative research was conducted. Quantitative research is conducted when a research question involves identifying patterns by measuring numerical data points (Creswell, 2014). To conduct the quantitative research, a nonexperimental, correlational approach was used. The nonexperimental approach begins with providing a numerical description of trends with the identification of a group of subjects (Creswell, 2014). This approach was utilized as it allows for the relationship between highly paid NFL players and team performance to be clearly compared. One team from each of the eight NFL divisions was randomly selected. Using Over the Cap, a website that tracks NFL transaction data, the top three highest paid players per randomly selected team (2020-2024) were identified to determine their salary cap percentage. The teams were labeled to maintain objectivity. The teams selected are as follows:
- Team A (NFC North)
- Team B (NFC South)
- Team C (NFC East)
- Team D (NFC West)
- Team E (AFC North)
- Team F (AFC South)
- Team G (AFC East)
- Team H (AFC West)

Here, the Buffalo Bills’ projected top 3-highest-paid players of 2026 are shown. The Buffalo Bills were not a selected team for this research, and this sample does not have any impact on the outcomes of this research. This information would be used to identify which players’ cap numbers would account to the percentage of the cap that the top 3 highest-paid players absorb. The section labeled “Cap Number” is the metric that was used to calculate the cap percentage. In this case, Josh Allen, Dion Dawkins, and D.J. Moore would be the players that account to the overall percentage, as they are set to be the top three highest-paid players on the Bills in the 2026-2027 season.



Displayed here are the current contracts of Josh Allen, Dion Dawkins, and D.J. Moore, respectively. Their cap percentages would be added together (18.8%, 8.3%, 8.2%) to create the overall cap percentage of the top three highest-paid players for that certain season. Since the top three highest-paid players tend to change every season, the overall percentage was calculated for each individual season.
Next, using Pro Football Reference, an online database for NFL statistics, team records from 2020-2024 will be identified. The information on both Over the Cap and Pro Football Reference correlate with comparable football data sites, quantify feasible results, and measure their intended content. Both websites are reliable and consistent in their data collection. To compare the success of each team, season win percentages were identified. Season win percentages indicate the level of success a respective team has against the entire league, making it a measurable statistic for performance level. The closer the season win percentage is to a value of one, the better the team performed in that respective season.
Then, the correlation between the season win percentage and the salary cap percentage was assessed. Since the records for teams tend to change every season, this was determined for each individual season. The scatter plots were created using Scatter Plot Creator.
In the NFL, front offices tend to manipulate contracts by using void years or signing bonuses, which can cause a measurement error. To mitigate this, the researcher used the “Cap Number” section to keep consistent measurement. Additionally, in a physical sport like football, injuries are inevitable. Even when high-paid, elite players are sidelined, they are still taking a hit against the salary cap. In the situation where all three of the highest paid players miss 50% or more of their regular season games, the given team was identified as a possible outlier. This ensured that the correlation analysis accurately distinguishes between finances and physical availability.
The data collection techniques utilized in this research include calculating averages and correlation. Averages were calculated to measure the tendencies of the salary cap. Pearson’s correlation coefficient r was used to measure the strength and direction of the relationship between salary cap percentage and team performance. A strength of relationship between plus/minus 0.1-0.3 is considered weak, between plus/minus 0.3-0.5 is considered medium, and between plus/minus 0.5-1.0 is considered strong.
The independent variable is the salary cap percentage for the top three highest paid players (“cap concentration”) for each team. The dependent variable is the team performance as measured by the season record.
Similarly, the revenue of each NFL team was taken for each individual season and compared with the same cap concentrations used before. The revenue for each individual season was determined using Statista, and scatter plots were created using Scatter Plot Calculator. The independent variable, cap concentration of the top three highest paid players, was correlated with the dependent variable, team revenue (single season), using Pearson’s correlation coefficient r to measure the strength and direction of the relationship between performance and revenue. Finding the correlation between these two variables helped identify how roster concentration affects the entire organization, not just the physical side of football. Since 2020 was impacted by the global pandemic, all data points that include that year were identified as potential outliers.
Findings
In the quantitative analysis utilizing Pearson’s r, it was first found that there was a correlation of r=0.53 between the cap concentration of the top three highest paid players and season record. A correlation of r=0.53 suggests a moderate relationship, meaning that while there is a trend between cap concentration and season record, the strength of the trend depends on an organization’s context. The positive relationship establishes the idea that as there is a greater cap concentration, there tends to be a higher season record. The r2 value found was 0.28, meaning that 28% of the fluctuation in a team’s record can be explained by the cap concentration.
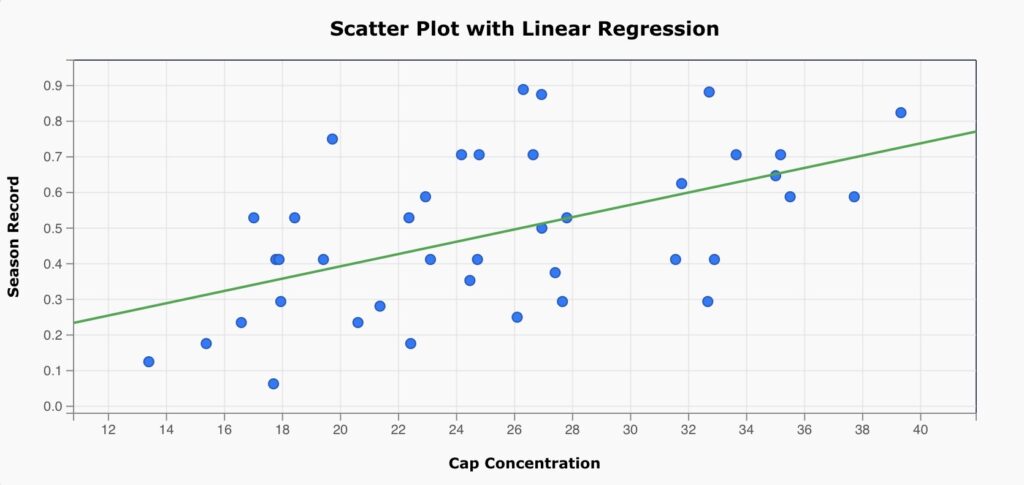
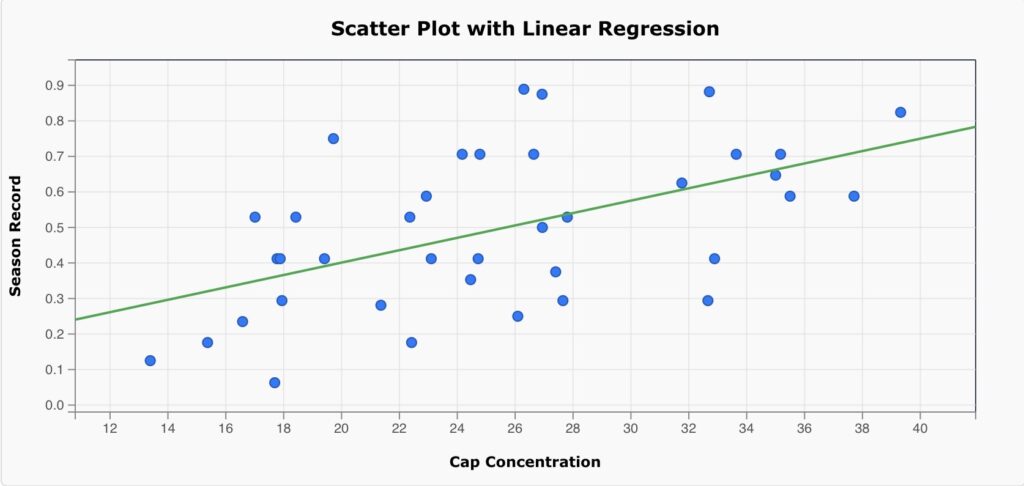
In the process of data collection, there were two instances where the top three highest paid players for a given season were all placed on IR until the cumulation of the season. Therefore, correlation was determined without these two data points and as a result, a slightly stronger relationship of r=0.54 was determined. While still a moderate relationship, the increased strength suggests that when top paid players are not playing, it has a negative impact on team performance. The r2 value found was 0.29, meaning that 29% of the fluctuation in a team’s record can be explained by the cap concentration.
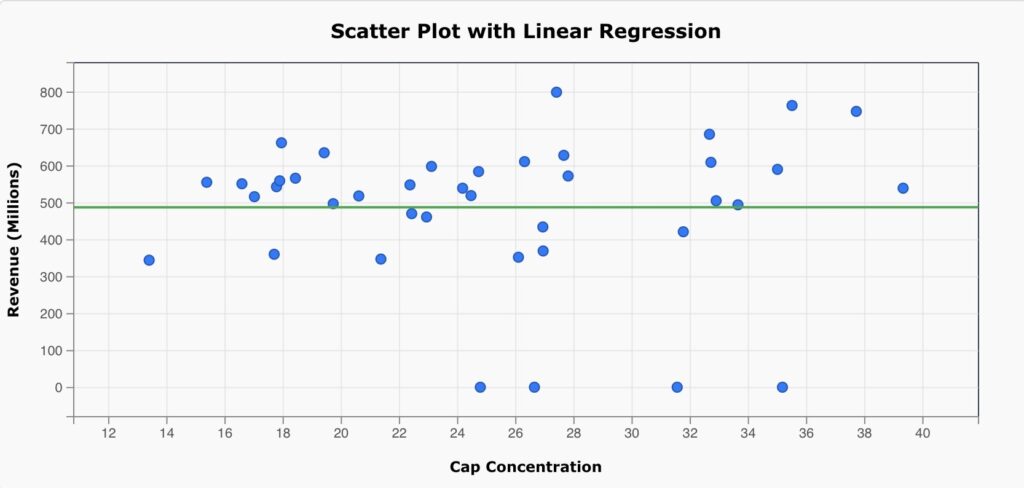
Next, in the assessment of the relationship between cap concentration and team revenue, a correlation of r=0.0003 was found. A correlation of r=0.0003 suggests an extremely weak relationship, meaning that there is no trend between cap concentration and team revenue. While there is a positive relationship between the two variables, it has minimal meaning due to the weak correlation. The r2 value found was 0, meaning that cap concentration is not a determinant of season record.
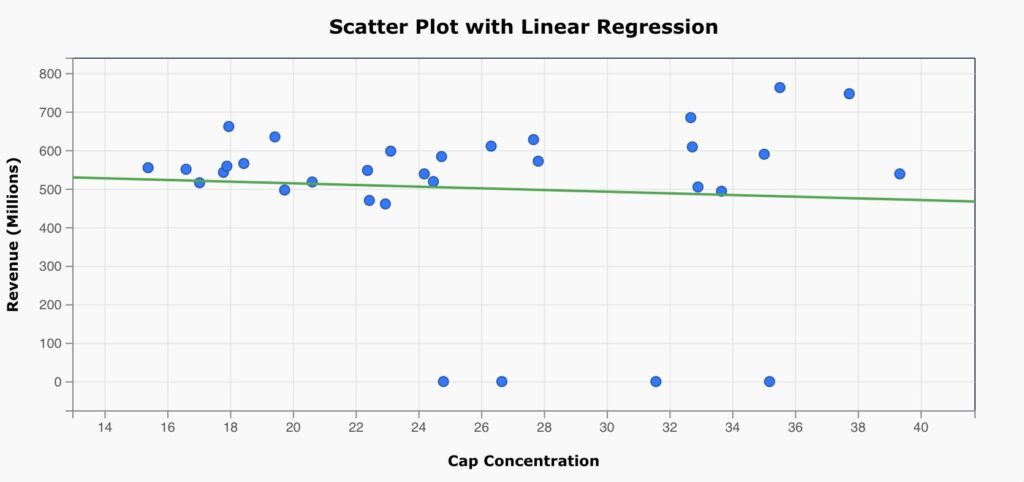
Since the 2020 pandemic caused worldwide financial stress, the relationship between season record and team revenue was assessed a second time, excluding any data points for 2020. A slightly stronger, while still weak correlation of r=-0.074 was found. The negative relationship establishes the idea that as the season record improves, team revenue decreases. Even though there is a slightly clearer correlation than the correlation including 2020, it is too small to be valued. The r2 value found was 0.01, meaning that cap concentration has an extremely negligible determinant of season record.
Analysis
Based on the correlational analysis between cap concentration and season record, it can be concluded that paying athletes high salaries has a beneficial effect on team outcomes. While there are many contextual factors that can cause a higher cap concentration to negatively affect a team, or cause a lower cap concentration to positively affect a team, the general trend suggests that spending more on talent correlates with winning.
This trend finds significant support within the discussion of sports economics. Specifically, it validates Woods’s findings that it is important to invest in elite talent, as enhanced performance at quarterback enhances the season record; however, it is also suggested that high win totals and high spending is a matter of spending effectively, not spending more. As Renkoski notes, elite teams allocate portions of their cap to certain players and positions, while also finding talent through the draft. Hence, teams that have found success with high cap concentrations have also likely structured the rest of their team in a draft focused, developmental format. While the correlational analysis between cap concentration and season record suggests that higher spending equals higher performance, teams that spent great amounts of money, yet did not perform at high levels reflect Higgins’ findings of low returns.
Based on the correlational analysis between cap concentration and team revenue, it can be concluded that paying athletes high salaries has little to no effect on team outcomes. Defined in Atkinson’s research, “revenue-sharing” limits the amount of growth an NFL team can make beyond team-focused sales. While it has been found that revenue is not impacted through research analyzing the correlation between team record and team revenue, the correlation found between cap concentration and team revenue further exemplifies the fixation of the revenue in the NFL. Bolstering Bradbury’s findings, there is a minimized ceiling for fiscal growth in the NFL.
Ultimately, between 2020 and 2024, paying athletes large amounts of money in the NFL has yielded a positive on-field impact, but a negligible impact on team revenue. Overpaying elite athletes serves as a possible, yet not guaranteed, strategy for improving a team’s competitive standing in the league. The relationship between cap concentration and season record improved when addressing injuries, confirming that while spending more money can be beneficial, organizational context and efficiency can determine whether or not spending more was worth it. In comparison to other sports leagues, the NFL has a unique market, separating revenue from wins; hence, a greater cap concentration does not drive any fiscal growth.
Future Direction
While this study included data from a fourth of the league’s teams, incorporating data from all 32 teams would be beneficial to the scope of the study. With only a portion of NFL teams being represented in this research, which were also chosen randomly, more accurate findings would stem from using data from the entire league. Further, the idea that cap concentration has no impact on fiscal growth points toward a focus from revenue to competitive efficiency. Future research should investigate metrics across different positions to determine spending patterns, which would combat the potential of injury in the study. While this research concludes that roster spending does not have an impact on revenue, it does not assess the correlation between cap concentration and postseason success, which could be seen as a more valuable metric to teams. Further, a deeper comparison between the NFL (strict cap ceiling) and the MLB/NBA (soft cap ceiling) could discover the impact of having a regulatory fiscal environment on organizational behaviors. If a large portion of an organization’s revenue is solidified due to revenue sharing, the concept of NFL owners being more or less aggressive in comparison to other leagues in financial doings could be assessed. Expanding the scope of this analysis to marketing could also reveal if a higher cap concentration impacts certain metrics like jersey sales, or fan numbers. These metrics may not be reflected in a team’s localized revenue, but they would influence long-term team evaluation.
Works Cited
Atkinson, Scott. “Revenue Sharing as an Incentive in an Agency Problem: An Example from the
National Football League.” The RAND Journal of Economics, Spring 1988.
https://www.jstor.org/stable/pdf/2555395.pdf?refreqid=fastly-default%3A82d772c90546
7c31d00594960a00d839&ab_segments=&initiator=&acceptTC=1.
Berri, David. “Salary Determination in the Presence of Fixed Revenues.” International Journal
of Sport Finance. https://ideas.repec.org/a/jsf/intjsf/v10y2015i1p5-25.html.
Bradbury, Charles John. “Determinants of Revenue in Sports Leagues: An Empirical
Assessment.” Kennesaw State University, March 2019.
https://digitalcommons.kennesaw.edu/econ_facpubs/15/.
Creswell, John. Research Design: Qualitative, Quantitative, and Mixed Methods Approaches.
SAGE Publications, 2014.
“Economics 101.” NFLPA, 27 October 2021. https://nflpa.com/posts?topic=42224&page=2.
Higgins, Joseph. “Evaluating the Value of an NFL Quarterback.” State University of New York,
Spring 2022.
https://soar.suny.edu/server/api/core/bitstreams/9fdb9036-7f18-4689-8d7a-24ab8b8b4880
Mulholland, Jason. “Optimizing the allocation of funds of an NFL team under the salary cap.”
International Journal of Forecasting, 28 December 2018.
https://www.sciencedirect.com/science/article/abs/pii/S0169207018301559.
O’Connor, Christopher. “Heart Failure Leadership, Culture, and Governance: Lessons Learned
From Tom Brady.” National Library of Medicine.
https://pubmed.ncbi.nlm.nih.gov/33795118/.
Posmanick, Benjamin. “Income Taxes and Firm Competitiveness: A Case Study from the
National Football League.” Multidisciplinary Digital Publishing Institute, 7 November
2025. https://www.mdpi.com/2227-7072/13/4/212.
Renkoski, Peter. “Where Should NFL Teams Invest Their Financial Resources?” Samford
University, 15 May 2021.
https://www.samford.edu/sports-analytics/fans/2021/Where-Should-NFL-Teams-Invest-T
Walsh, Ronan. “Identifying significant features for Player Evaluation in NFL comparing ANNs
and Traditional Models.” Technological University Dublin, 2021.
https://arrow.tudublin.ie/scschcomdis/240/.
Woods, Brendan. “Quarterback Statistics vs. Season Success.” Louisiana Tech University, Spring
2025. https://digitalcommons.latech.edu/mathematics-senior-capstone-papers/51/.