While the NHL playoffs are coming to a close, the draft, which takes place from June 26th to 27th, draws closer.
Teams draft based on value, meaning the elite players tend to leave in the first round; however, how much of a correlation does draft position have with future NHL pay?
To assess this, the 2020 draft was selected to identify a player pool. Since all of the players drafted in 2020 would not be playing on any sort of rookie deal, this year was chosen. The draft selections (1-217) were identified using Elite Prospects records. The current pay of the 2020 draftees was determined with Spotrac, using the 2025-2026 Salary Cap Hit metric.
The independent variable in this study was the draft number of a given player, and the dependent variable was the salary cap hit of a given player in the 2025-2026 season. For players that are free agents, or are retired, their 2025-2026 salary cap hit was listed as 0 for the purposes of this study. There was no information for a player selected at #49, so no data was included for the metric.
All seven rounds of the 2020 draft were analyzed holistically:
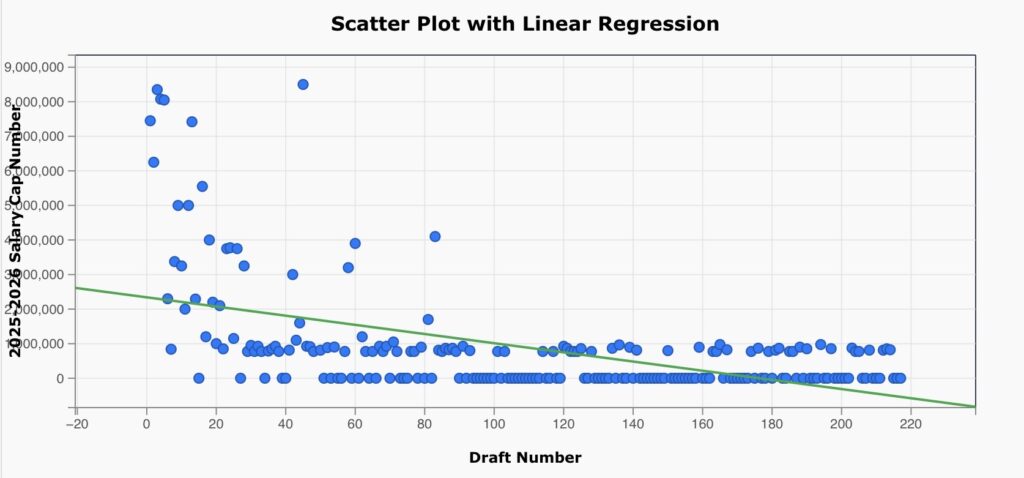
A correlation of r=-0.52 was found, indicating a negative, moderate relationship. The negative correlation indicates that as draft number increases, 2025-2026 salary cap hit decreases. Since the relationship is moderate, it creates the idea that while having a higher draft number points toward success, there is still variance in future pay. An r2 value of 27% was found, meaning that 73% of the factors that go into salary cap hit do not include draft number.
The first round of the 2020 draft was analyzed individually:
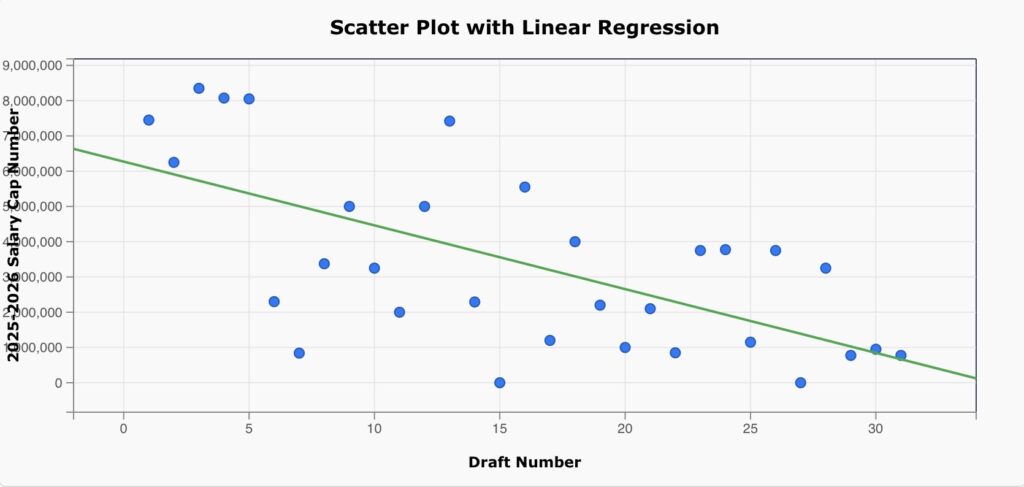
A correlation of r=-0.64 was found, indicating a negative, moderate-strong relationship. The negative correlation suggests that as draft number increases, 2025-2026 salary cap hit decreases. Since the relationship is moderate-strong, it creates the idea there is a greater chance of higher pay when being paid closer to the latter end of the first round, there remains a certain degree of variance. An r2 value of 41% was found, meaning that 59% of the factors that go into salary cap hit do not include draft number.
The second round of the 2020 draft was analyzed individually:
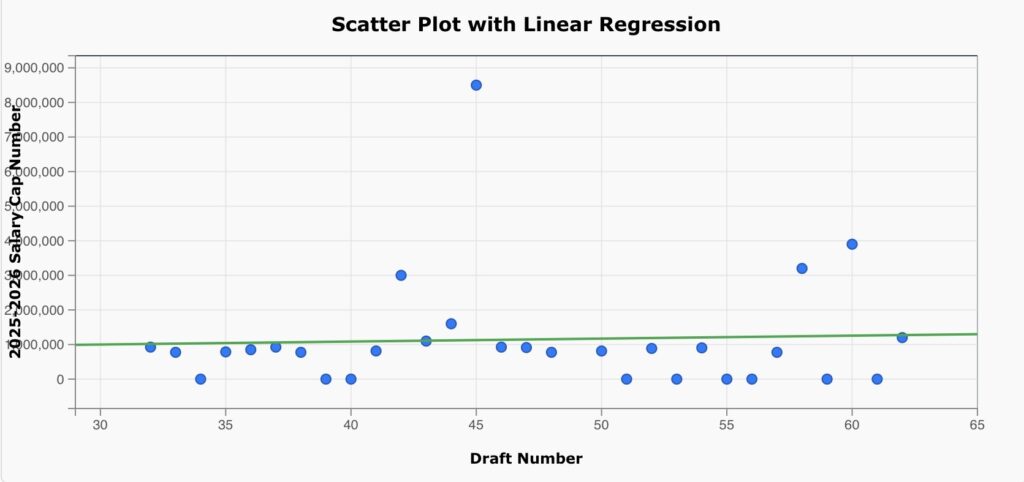
A correlation of r=0.05 was found, indicating a positive, weak relationship. The positive correlation suggests that as draft number increases, 2025-2026 salary cap hit decreases. Since the relationship is weak, it creates the idea that there is more variability in the latter rounds of the draft. An r2 value of 0% was round, meaning that 100% of the factors that go into salary cap hit do not include draft number.
| 1 | 7450000 |
| 2 | 6250000 |
| 3 | 8350000 |
| 4 | 8075000 |
| 5 | 8050000 |
| 6 | 2300000 |
| 7 | 839725 |
| 8 | 3375000 |
| 9 | 5000000 |
| 10 | 3250000 |
| 11 | 2000000 |
| 12 | 5000000 |
| 13 | 7420087 |
| 14 | 2290457 |
| 15 | 0 |
| 16 | 5550000 |
| 17 | 1200000 |
| 18 | 4000000 |
| 19 | 2200000 |
| 20 | 1000000 |
| 21 | 2100000 |
| 22 | 850000 |
| 23 | 3750000 |
| 24 | 3775000 |
| 25 | 1150000 |
| 26 | 3750000 |
| 27 | 0 |
| 28 | 3250000 |
| 29 | 775000 |
| 30 | 950000 |
| 31 | 775000 |
| 32 | 925000 |
| 33 | 775000 |
| 34 | 0 |
| 35 | 787500 |
| 36 | 850000 |
| 37 | 925000 |
| 38 | 775000 |
| 39 | 0 |
| 40 | 0 |
| 41 | 813750 |
| 42 | 3000000 |
| 43 | 1100000 |
| 44 | 1600000 |
| 45 | 8500000 |
| 46 | 925000 |
| 47 | 912500 |
| 48 | 775000 |
| 50 | 812500 |
| 51 | 0 |
| 52 | 886667 |
| 53 | 0 |
| 54 | 903333 |
| 55 | 0 |
| 56 | 0 |
| 57 | 775000 |
| 58 | 3200000 |
| 59 | 0 |
| 60 | 3900000 |
| 61 | 0 |
| 62 | 1200000 |
| 63 | 775000 |
| 64 | 0 |
| 65 | 775000 |
| 66 | 0 |
| 67 | 925000 |
| 68 | 775000 |
| 69 | 925000 |
| 70 | 0 |
| 71 | 1050000 |
| 72 | 775000 |
| 73 | 0 |
| 74 | 0 |
| 75 | 0 |
| 76 | 775000 |
| 77 | 775000 |
| 78 | 0 |
| 79 | 900000 |
| 80 | 0 |
| 81 | 1700000 |
| 82 | 0 |
| 83 | 4100000 |
| 84 | 812500 |
| 85 | 775000 |
| 86 | 867500 |
| 87 | 825000 |
| 88 | 867500 |
| 89 | 775000 |
| 90 | 0 |
| 91 | 925000 |
| 92 | 0 |
| 93 | 800000 |
| 94 | 0 |
| 95 | 0 |
| 96 | 0 |
| 97 | 0 |
| 98 | 0 |
| 99 | 0 |
| 100 | 0 |
| 101 | 775000 |
| 102 | 0 |
| 103 | 775000 |
| 104 | 0 |
| 105 | 0 |
| 106 | 0 |
| 107 | 0 |
| 108 | 0 |
| 109 | 0 |
| 110 | 0 |
| 111 | 0 |
| 112 | 0 |
| 113 | 0 |
| 114 | 775000 |
| 115 | 0 |
| 116 | 0 |
| 117 | 775000 |
| 118 | 0 |
| 119 | 0 |
| 120 | 925000 |
| 121 | 867500 |
| 122 | 775000 |
| 123 | 775000 |
| 124 | 775000 |
| 125 | 858000 |
| 126 | 0 |
| 127 | 0 |
| 128 | 775000 |
| 129 | 0 |
| 130 | 0 |
| 131 | 0 |
| 132 | 0 |
| 133 | 0 |
| 134 | 867500 |
| 135 | 0 |
| 136 | 965000 |
| 137 | 0 |
| 138 | 0 |
| 139 | 895000 |
| 140 | 0 |
| 141 | 812500 |
| 142 | 0 |
| 143 | 0 |
| 144 | 0 |
| 145 | 0 |
| 146 | 0 |
| 147 | 0 |
| 148 | 0 |
| 149 | 0 |
| 150 | 800000 |
| 151 | 0 |
| 152 | 0 |
| 153 | 0 |
| 154 | 0 |
| 155 | 0 |
| 156 | 0 |
| 157 | 0 |
| 158 | 0 |
| 159 | 896250 |
| 160 | 0 |
| 161 | 0 |
| 162 | 0 |
| 163 | 775000 |
| 164 | 775000 |
| 165 | 975000 |
| 166 | 0 |
| 167 | 825000 |
| 168 | 0 |
| 169 | 0 |
| 170 | 0 |
| 171 | 0 |
| 172 | 0 |
| 173 | 0 |
| 174 | 775000 |
| 175 | 0 |
| 176 | 870000 |
| 177 | 0 |
| 178 | 0 |
| 179 | 775000 |
| 180 | 0 |
| 181 | 812500 |
| 182 | 867500 |
| 183 | 0 |
| 184 | 0 |
| 185 | 775000 |
| 186 | 775000 |
| 187 | 0 |
| 188 | 900000 |
| 189 | 0 |
| 190 | 852500 |
| 191 | 0 |
| 192 | 0 |
| 193 | 0 |
| 194 | 975000 |
| 195 | 0 |
| 196 | 0 |
| 197 | 855000 |
| 198 | 0 |
| 199 | 0 |
| 200 | 0 |
| 201 | 0 |
| 202 | 0 |
| 203 | 872500 |
| 204 | 775000 |
| 205 | 775000 |
| 206 | 0 |
| 207 | 0 |
| 208 | 813750 |
| 209 | 0 |
| 210 | 0 |
| 211 | 0 |
| 212 | 812500 |
| 213 | 851667 |
| 214 | 823750 |
| 215 | 0 |
| 216 | 0 |
| 217 | 0 |