The NBA playoffs are currently in full swing, and after the NBA Championship on June 3rd, the next major event will be the draft.
Teams draft based on value, meaning the elite players tend to leave in the first round; however, how much of a correlation does draft position have with future NBA pay?
To assess this, the 2020 draft was selected to identify a player pool. Since all of the players drafted in 2020 would not be playing on their rookie contracts, this year was chosen. The draft selections (1-60) were identified using ESPN records. The current pay of the 2020 draftees was determined with Basketball Reference, using the 2025-2026 salary metric.
The independent variable in this study was the draft position of a given player, and the dependent variable was the amount of money the player is set to be paid in the 2025-2026 season. For players that are free agents, are playing in a different football league, or are retired, their 2025-2026 salary was listed as 0 for the purposes of this study.
Both rounds of the 2020 draft were analyzed holistically:
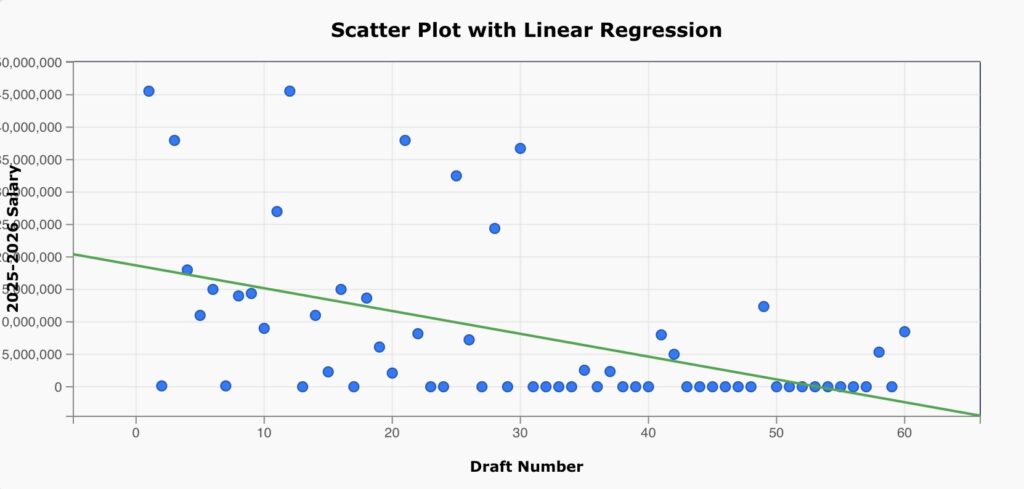
A correlation of r=-0.49 was found, indicating a negative, moderate relationship. The negative correlation indicates that as draft number increases, 2025-2026 salary decreases. Since the relationship is moderate, it is clear that while having a higher draft number points towards greater fiscal success, there is no guarantee. An r2 value of 25% was found, meaning that 75% of the factors that go into salary do not include draft number.
The first round of the 2020 draft was analyzed individually:
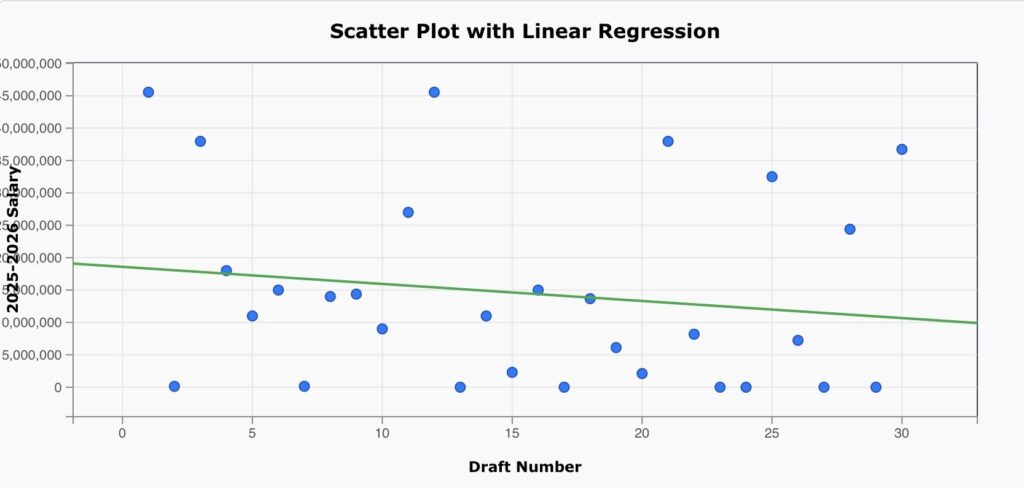
A correlation of r=-0.16 was found, indicating a negative, weak relationship. The negative correlation indicates that as draft number increases, 2025-2026 salary decreases. Since the relationship is weak, it is evident that while success is more likely when being selected 1-10, talent can be found in the latter end of the first round.
The second round of the 2020 draft was analyzed individually:
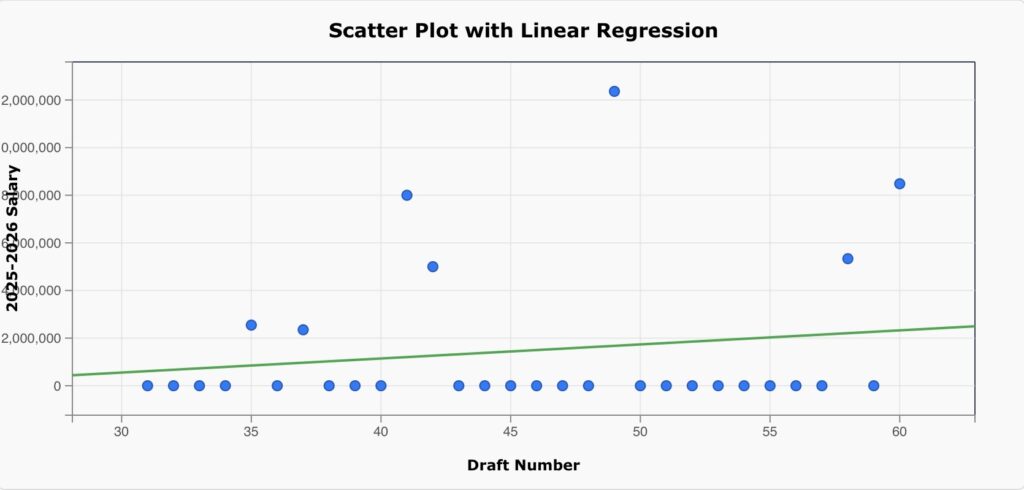
A correlation of r=0.16 was found, indicating a positive, weak relationship. The negative correlation indicates that as draft number increases, 2025-2026 salary increases; however, since the relationship is weak, this information is largely irrelevant. Standout players Isaiah Joe and Sam Merill were some of those that created a positive relationship, suggesting that variance and partial luck play major roles in second round selections.
| 1 | 45550512 |
| 2 | 131970 |
| 3 | 37958760 |
| 4 | 18000000 |
| 5 | 11000000 |
| 6 | 15000000 |
| 7 | 131970 |
| 8 | 14000000 |
| 9 | 14375000 |
| 10 | 9000000 |
| 11 | 27000000 |
| 12 | 45550512 |
| 13 | 0 |
| 14 | 11000000 |
| 15 | 2296274 |
| 16 | 15000000 |
| 17 | 0 |
| 18 | 13666667 |
| 19 | 6118644 |
| 20 | 2111516 |
| 21 | 37958760 |
| 22 | 8177778 |
| 23 | 0 |
| 24 | 0 |
| 25 | 32500000 |
| 26 | 7232143 |
| 27 | 0 |
| 28 | 24393104 |
| 29 | 0 |
| 30 | 36725670 |
| 31 | 0 |
| 32 | 0 |
| 33 | 0 |
| 34 | 0 |
| 35 | 2546675 |
| 36 | 0 |
| 37 | 2349578 |
| 38 | 0 |
| 39 | 0 |
| 40 | 0 |
| 41 | 8000000 |
| 42 | 5000000 |
| 43 | 0 |
| 44 | 0 |
| 45 | 0 |
| 46 | 0 |
| 47 | 0 |
| 48 | 0 |
| 49 | 12362338 |
| 50 | 0 |
| 51 | 0 |
| 52 | 0 |
| 53 | 0 |
| 54 | 0 |
| 55 | 0 |
| 56 | 0 |
| 57 | 0 |
| 58 | 5335894 |
| 59 | 0 |
| 60 | 8482144 |