There are endless components that play a role in the formulation of a National Football League Franchise, ranging from executive leadership and coaching staffs to player development and a winning culture.
All of the time, money, and effort focused on a given franchise gives the team its identity. The success of teams can be measured by one statistic: their win percentage. Just as there are many factors that play into the performance of a franchise in itself, there are many factors that play into a single win.
In theory, the team that is able to perform both offensively and defensively will see the most success, and at the center of that balance lies the battle of possession. Because turnovers simultaneously reward a defense and penalize an offense, this research investigates the degree to which turnover efficiency correlates with a franchise’s winning percentage over time.
To determine the exact impact of turnovers on win percentage, a correlational study was conducted. The turnover differential for each NFL team was identified using FOX Sports data, and win percentage for each NFL team was identified using ESPN. The independent variable is the amount of turnovers a given team had during the 2025-2026 season, and the dependent variable is the win percentage for a given team during the 2025-2026 season. The scatter plot was made using Standard Deviation Calculator.
The results are as follows:
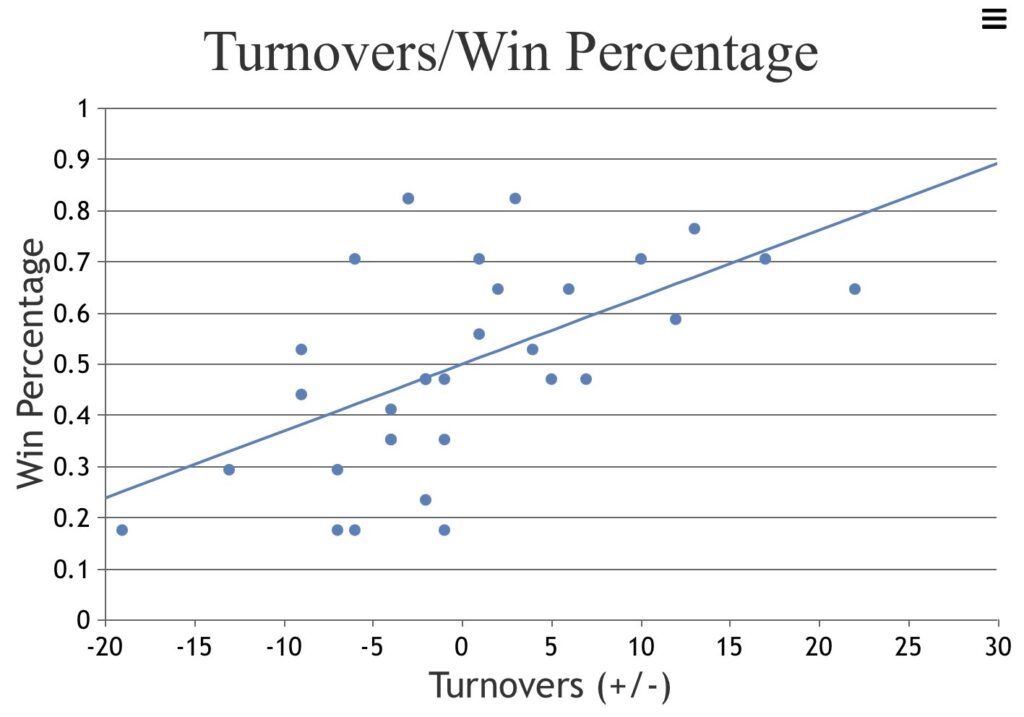
After the correlational analysis using Pearson’s correlation coefficient r was conducted, a correlation of r=0.55 was found. The positive correlation indicates that the more times a team regained the possession of the ball, the higher their win percentage was. A moderate relationship was found, suggesting that while there is a clear trend present, there are other variables that play into a team’s win percentage.
Teams with dynamic defenses generate more turnovers than teams with poor to average defenses, yet if the offense is not able to capitalize on the momentum chance, victory is not guaranteed. While the net amount of turnovers accounts for the offense and defense, any imbalances between the two are still buried.
| Team | plus/minus | Win % |
| CHI | 22 | 0.647 |
| HOU | 17 | 0.706 |
| JAX | 13 | 0.765 |
| PIT | 12 | 0.588 |
| LAR | 10 | 0.706 |
| TB | 7 | 0.471 |
| PHI | 6 | 0.647 |
| ATL | 5 | 0.471 |
| DET | 4 | 0.529 |
| NE | 3 | 0.824 |
| LAC | 2 | 0.647 |
| BUF | 1 | 0.706 |
| GB | 1 | 0.559 |
| ARI | -1 | 0.176 |
| KC | -1 | 0.353 |
| IND | -1 | 0.471 |
| NYG | -2 | 0.235 |
| CAR | -2 | 0.471 |
| BAL | -2 | 0.471 |
| DEN | -3 | 0.824 |
| SEA | -3 | 0.824 |
| CIN | -4 | 0.353 |
| MIA | -4 | 0.412 |
| NO | -4 | 0.353 |
| SF | -6 | 0.706 |
| TEN | -6 | 0.176 |
| CLE | -7 | 0.294 |
| LV | -7 | 0.176 |
| DAL | -9 | 0.441 |
| MIN | -9 | 0.529 |
| WAS | -13 | 0.294 |
| NYJ | -19 | 0.176 |